
.png)

D3 - a tool to communicate our insights quickly and effectively…
- Anisha Mohanty
- Jan 30, 2021
- 5 min read

Audience This blog is created for budding professionals who want to build their career in data science and specifically data visualization. This is to make you comfortable in getting started with the Data-Driven Documents library and its various methods.
Data Visualization Data visualization is an interdisciplinary field in machine learning that deals with the graphic representation of data. It is an efficient way of communicating when the data is numerous as for example a Time Series. We all know well, how data can speak for itself, i.e. we have already laid an emphasis on the importance of visualizing
data. As a data scientist, our true aim should be explaining a model to our clients, who mostly deal with non-analytics data and don't want numbers as their final result, but want a beautifully crafted story or visual using those numbers. Hence in this blog, we will be accomplishing this task using D3.js that uses visual data to communicate information, which is universal, fast and effective.
D3.js Visual representations of data are the most effective means of conveying meaningful information and D3 provides a great deal of ease and flexibility to create these data visualizations. It is dynamic, intuitive and needs a minimum amount of effort. D3 stands for Data-Driven Documents. It is an open-source JavaScript library developed by Mike Bostock to create custom interactive data visualizations in the web browser using SVG, HTML and CSS. D3.js will stay in the state of the art for at least next five years. There is no competitor at the moment which is even close to the functionality.
Official website - d3js.org
D3 Source code - https://github.com/d3/d3
Use Cases… I have taken this example from Tutorials point’s D3 tutorial … Besides giving an introduction to the D3 libraries separately, I will try my best to incorporate all the important specifications and characteristics of this JavaScript library to be understood with this code.
Step 1 : Workspace Setup
Before Starting, for setting up the development environment, we need a D3 library, Web server, Editor and a Web Browser.
Prerequisites : Basics of Html, CSS, JavaScript and SVG.
Step 2:
In this block, CSS style tags are used which makes the webpage more pleasant to look at, along with the HTML structure, which in turn describes how elements are rendered and positioned in the webpage.
<!DOCTYPE html>
<html>
 <head>
 <style>
 .bar {
            fill: green;
 }
 .highlight {
            fill: red;
 }
 .title {
            fill: blue;
            font-weight: bold;
 }
 </style>
Step 3:
We can download the D3 libraries or else we can include the D3.js library using the CDN URL https://d3js.org/d3.v4.min.js
 <script src = "https://d3js.org/d3.v4.min.js"></script>
 <title> Animated bar chart </title>
 </head>
Step 4:
This is to Declare Variables and SVG attributes using the script tag and create an SVG canvas. SVG (Scalable Vector Graphics) is basically an XML-based vector graphics format (text-based) which in turn provides options to draw different shapes.
 <body>
 <svg width = "500" height = "500"></svg>
 <script>
 var svg = d3.select("svg"),
         margin = 200, width = svg.attr("width") - margin,
         height = svg.attr("height") - margin;
html(), attr(), and style() methods are used to modify the content and styles of the selected elements.
The html content of the selected or appended elements are set by the html() method.
To add or update the attributes of the selected elements, the attr() method is used and similarly to set the style and property, the style() method is used.
Here specifically, append is used to append text elements.
Step 5:
In this block we will be adding DOM elements using append() and text() methods to the HTML structure. The append() method appends a new element as the last child of the element in the current selector. This method can also modify the style of the elements, their attributes, properties, HTML and text content. The text() method is used to set the content of the selected / appended elements.
         svg.append("text")
 .attr("transform", "translate(100,0)")
 .attr("x", 50).attr("y", 50)
 .attr("font-size", "20px")
 .attr("class", "title")
 .text("Population bar chart")
Step 6:
Here this snippet is used to create a scale range and append the group elements.
 var x = d3.scaleBand().range([0, width]).padding(0.4),
         y = d3.scaleLinear().range([height, 0]);
  var g = svg.append("g")
 .attr("transform", "translate(" + 100 + "," + 100 + ")");
Step 7 Read data:
Data can be read from dummy data, csv, excel, json files and data can even be fetched from Databases.
Year, population
2006, 40
2008, 45
2010, 48
2012, 51
2014, 53
2016, 57
2017, 62
         d3.csv("data.csv", function(error, data) {
 if (error) {
 throw error;
 }
Step 8:
Setting X and Y domain
            x.domain(data.map(function(d) { return d.year; }));
            y.domain([0, d3.max(data, function(d) { return d.population; })]);
Step 9:
Adding X-axis to the transformation
            g.append("g")
 .attr("transform", "translate(0," + height + ")")
 .call(d3.axisBottom(x))
 .append("text")
 .attr("y", height - 250)
 .attr("x", width - 100)
 .attr("text-anchor", "end")
 .attr("font-size", "18px")
 .attr("stroke", "blue").text("year");
Step 10:
Adding Y-axis to the transformation
            g.append("g")
 .append("text")
 .attr("transform", "rotate(-90)")
 .attr("y", 6)
 .attr("dy", "-5.1em")
 .attr("text-anchor", "end")
 .attr("font-size", "18px")
 .attr("stroke", "blue")
 .text("population");
Step 11:
In this snippet append the group elements and transformation is added to Y-axis
            g.append("g")
 .attr("transform", "translate(0, 0)")
 .call(d3.axisLeft(y))
select() method is used to select only one DOM element by matching the given CSS selectors. In case if there are more than one matching types for the given command, then it will select the first one only. It can be done in three ways:
Tag of a HTML element
Class name of a HTML element
ID of a HTML element
selectAll() method is used to select multiple elements from the given HTML structure. Unlike select() method, selectAll() method will select all the elements that will match the specific selector tag.
Step 12:
Here the elements to be displayed in the bar graph are declared and defined. Here, we added the listener event for the mouseout and mouseover to perform animation. It applies the animation, when the mouse hovers over a particular bar and goes out of it.
            g.selectAll(".bar")
 .data(data)
 .enter()
 .append("rect")
 .attr("class", "bar")
 .on("mouseover", onMouseOver)
 .on("mouseout", onMouseOut)
 .attr("x", function(d) { return x(d.year); })
 .attr("y", function(d) { return y(d.population); })
 .attr("width", x.bandwidth()).transition()
Step 13:
The .ease(d3.easeLinear) function is used to perform apparent motion in animation. It processes the slow-in and the slow-out motion with a duration of 200. The delay can be calculated using −
 .ease(d3.easeLinear).duration(200)
 .delay(function (d, i) {
 return i * 25;
 })
 .attr("height", function(d) { return height - y(d.population); });
 });
Step 14: Mouseover Event Handler Function
Here, in the mouseover event, we want to increase the width and height of the bar, and the bar color of the selected bar to red. For the color, we have to add a class ‘highlight’, which will change the color of the selected bar to red.
A transition function to the bar for the duration of 200 milliseconds. When the width of the bar is increased by 5px, and the height by 10px, the transition from the previous width and height of the bar to the new width and height will be for the duration of 200 milliseconds.
 function onMouseOver(d, i) {
            d3.select(this)
 .attr('class', 'highlight');
            d3.select(this)
 .transition()
 .duration(200)
 .attr('width', x.bandwidth() + 5)
 .attr("y", function(d) { return y(d.population) - 10; })
 .attr("height", function(d) { return height - y(d.population) + 10; });
            g.append("text")
 .attr('class', 'val')
 .attr('x', function() {
 return x(d.year);
 })
 .attr('y', function() {
 return y(d.value) - 10;
 })
 }
Next, we have to calculate a new ‘y’ value to the bar, so that the bar does not distort due to the new height value.
Step 15: MouseOut event handler function
Here, in the mouseout event, we want to remove the selection features that we had applied in the mouseover event. Therefore, we revert the bar class to the original ‘bar’ class and restore the original width and height of the selected bar and restore the y value to the original value.
The d3.selectAll(‘.val’).remove() function is used to remove the text value we had added during the bar selection.
 function onMouseOut(d, i) {
            d3.select(this)
 .attr('class', 'bar');
            d3.select(this)
 .transition()
 .duration(200)
 .attr('width', x.bandwidth())
 .attr("y", function(d) { return y(d.population); })
 .attr("height", function(d) { return height - y(d.population); });
d3.selectAll('.val')
 .remove()
 }
 </script>
 </body>
</html>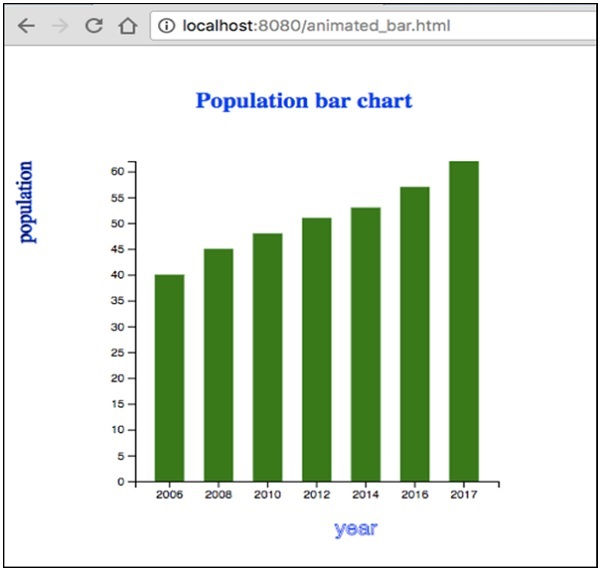
By executing the above code, we will be achieving this bar chart.
LEARNING
From this blog I have tried to explain the main methods and features of D3.js tool, using an example code of visualizing data in the form of an animated simple bar chart.
REFERENCES


Comments